It’s not surprising that wireless sensor networks are widely adopted nowadays for health monitor in civil engineering, especially in the geotechnical field. Many advantages that the system could offer outweigh the conventional method, wired transmissions, such as time-saving and economic efficiency in terms of installation, maintenance, and management for both existing and new structures. For that reason, we chose a wireless sensor network including 4 nodes and 1 gateway device for the resorvoir project to monitor the building tilts and the pore pressure behind the reservoir. In this post, I will give a brief description of wireless sensor networks and then move on to introduce details of the project as follows.
For a simple understanding, I just define the wireless sensor network herein includes three main items such as nodes, gateway, and server. Node has a microcontroller board as well as a radio and may or may not have a sensor that is typically powered by the battery. A gateway is a bridge between nodes and the server which functions to send and receive information to the node and server. The gateway communicates with the nodes through the LoRa radio while to the server through higher bandwidth communication protocols like wifi, ethernet, or cellular. The server is the controlling system that connects the gateways to deliver/present the data. Figure below shows the relationship among the nodes, gateway, and server that the nodes can be connected to the gateway by either using star-topology or mesh topology configurations. As illustrated in Figure a, the nodes communicate to the gateway directly while, as shown in Figure b, the nodes are connected to one another as well as the gateway. The gateway acts as a data sink that receives the data from the nodes, in the meantime, the server accesses the gateway by using a variety of internet communication options as mentioned above. Since the power consumption is the primary issue for the wireless sensor network, it depends on the project application to choose the types of configuration in order to save the battery power. For example, if the nodes are installed closely with each other and there are obstacles between nodes and gateway, the mesh topology configuration is a good choice. However, when the gateway is placed in the center among nodes and there are no obstacles between them, the star-topology could be chosen. In this project, the star-topology network configuration was selected.
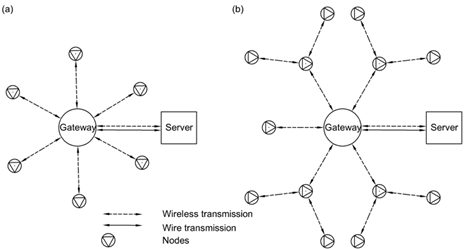
WSN configuration: (a) star-topology; (b) mesh topology
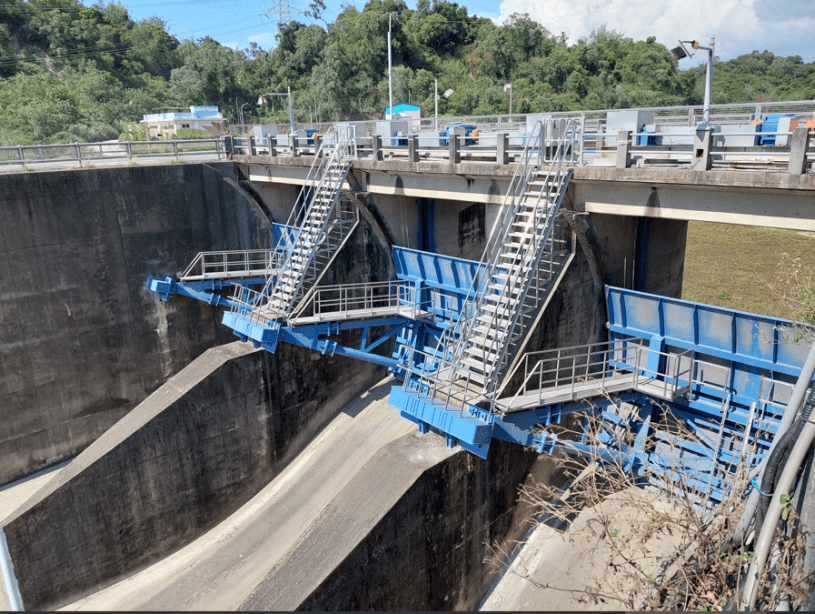
A multiple-function reservoir in southern Taiwan is introduced in this article. It’s responsible for water supply, irrigation, flood control, and tourism. It’s noted that we went to the site to install the monitoring datalogger and instruments at the same time as the reservoir was maintained. The system was installed in the reservoir to monitor the tilts and water pore pressure. The two nodes which attach the piezometer vibration wire sensors installed outside the dam and the other two tilt- nodes that detect the structure movement were placed on the building of the flood control and sediment-sluice tunnel construction. The server is installed on-site in the reservoir’s controlling building where the gateway is placed on the top floor of the building and connected to the computer server by using the RJ45 cable. Figure below shows the images of the wireless network system including the gateway, piezometer node, and tilts node.
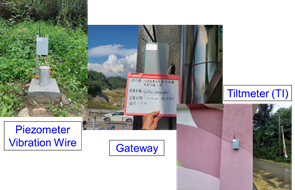
Images of the gateway and nodes on site
The illustration of the real-time monitoring system is presented in the Figure below. The star-topology configuration for the network was selected since the distance between nodes were not far away from the gateway and there were no obstacles to interrupt the transmission signal between them. By doing so, the time transmission could be shortened and power consumption could be minimized during the data transmission.
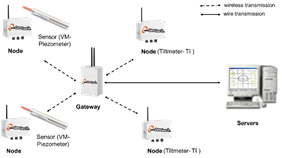
Illustrate the wireless sensor networks
The initial data obtained from the real-time wireless sensor network is shown below. The data from one tiltmeter sensor is selected to present the status of the monitoring system in this project. As shown in the figure, the movements of the building are displayed in three directions of X, Y, and Z. The figure proved that the data was continuously transmitted to the main server every hour without any interruption from May 31st to Jun 4th of 2022. Therefore, the wireless transmission network was in good condition and could be fully functioning for long-term monitoring in this project.
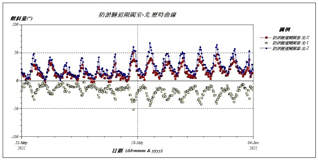
Time-history of tilts (from node-TI sensor)
Reservoir is introduced in this post to reflect one of the real-time wireless sensor networks that I’ve been involved in. As I mentioned above, the system herein includes a server, gateway, and several nodes which attach the sensors. The gateway and nodes communicate with each other by using long-range (LoRa) radio frequency transmission while the gateway transmits data to the server through wifi, 4G/5G wireless, or ethernet cable. For more details, please pay a visit here to read a full paper.
